圖表分析
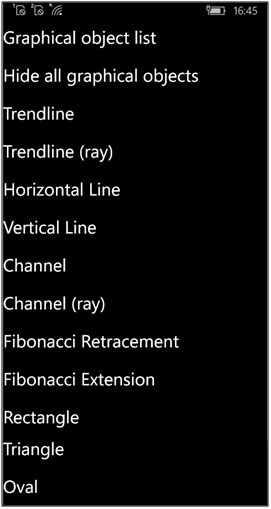
點擊圖標下面的第4個按鈕 "Graphical objects"(圖表分析)您能打開放置圖標分析的菜單,在此窗口中您還可以調整已有的圖表分析。
選出圖標分析後(比如"走勢線 (ray)" ),此圖表分析在"Select"狀態時,就可以放在圖標上:
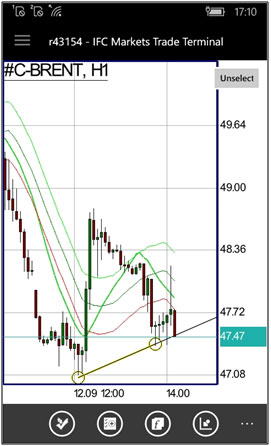
取消"Select"狀態請您點擊出現的按鈕"Unselect"。
點擊圖標上的某個圖表分析您能打開設置圖表分析的窗口:
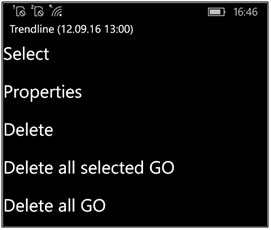
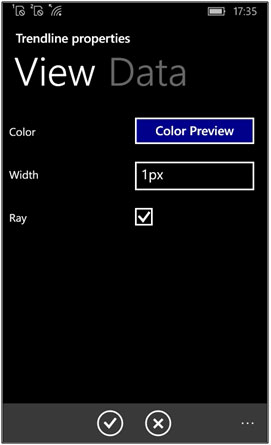
選出"Properties"(參數)功能,您可以設置圖表分析的參數(包括正確的地位) :
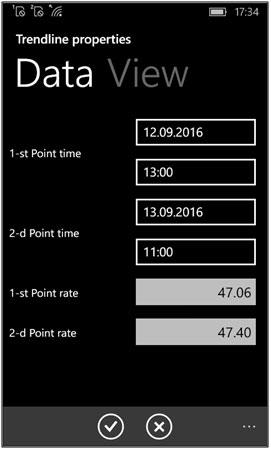
點擊"OK"並完成放置圖標過程。